Associated Lab Members
Gloria Chiang, M.D., is an associate professor with the Weill Cornell Medicine Department of Radiology Brain Health Imaging Institute (BHII), and with NewYork-Presbyterian Hospital (NYP). She is a board-certified radiologist with subspecialty certification in neuroradiology. Her research program focuses on combining quantitative magnetic resonance and positron emission tomography (MR) and (PET) imaging techniques with plasma and cerebrospinal fluid (CSF) biomarkers to elucidate the pathophysiology of neurodegenerative diseases.
Dr. Gloria Chiang is a Weill Cornell Medicine (WCM) neuroradiologist. Her research program is focused on combining quantitative magnetic resonance and positron emission tomography (QMR) and (PET) imaging techniques with plasma and cerebrospinal fluid (CSF) biomarkers to elucidate neurodegenerative disease pathophysiology. She is currently PI on a National Institutes of Health (NIH) R01 grant. The grant is aimed at investigating longitudinal changes in brain iron and oxidative stress relative to amyloidosis. Dr. Chiang is Co-I on several other NIH grants, applying innovative imaging techniques to the study of brain aging, multiple sclerosis, and Parkinson’s disease. Previously, she served as Site PI and Co-PI for Alzheimer’s Disease Neuroimaging Initiative (ADNI)-2 and ADNI-Department of Defense (DoD) studies, as well as the Imaging Dementia – Evidence for Amyloid Scanning (IDEAS) Study.
Currently, she serves on the editorial boards of the American Journal of Neuroradiology (AJNR) and the Journal of Neuroimaging. She is a Senior Member of the American Society of Neuroradiology (ASNR) and serves on the Executive Committee of the American Society of Functional Neuroradiology (ASFNR). She has served on several NIH scientific review panels. She has been invited to speak on imaging of neurodegenerative diseases at major national and international meetings, including the Radiological Society of North America (RSNA), ASNR, and the American Roentgen Ray Society (ARRS). She has trained over 100 radiology residents and neuroradiology fellows, and has served as a research mentor for more than 20 medical students, graduate students, residents, and fellows. She completed her medical training at Harvard Medical School, followed by a diagnostic radiology residency and neuroradiology fellowship at the University of California, San Francisco, where she was awarded the Margulis Society Outstanding Resident Researcher Award, and an NIH/National Institute of Biomedical Imaging and Bioengineering (NIBIB) Clinician-Scientist Training Grant in Biomedical Imaging.
Chiang Laboratory researchers use imaging, cerebrospinal fluid, and plasma biomarkers to investigate the underlying pathophysiology of Alzheimer’s disease (AD) and other neurological disorders. They are particularly interested in studying modifiable risk factors of these diseases, and using biomarkers to predict cognitive decline at early disease stages, before irreversible neuronal loss has occurred. Recent projects have explored the roles of inflammation and oxidative stress in AD; iron alterations relative to brain amyloidosis; macro- and microstructural-changes in apolipoprotein (APOE) e2 carriers; the relationship between microhemorrhages and tau pathology; and insulin resistance as an AD risk factor. A key focus of the lab: to identify ways of translating these research techniques and findings into clinical practice, particularly as they pertain to disease heterogeneity, atypical forms of AD, and mixed pathology dementias.
Tracy Butler, M.D.
Mony de Leon, Ed.D
Jonathan Dyke, Ph.D.
Howard Fine, M.D.
Susan Gauthier, D.O., MPH.
Makoto Ishii, M.D., Ph.D.
John Knisely, M.D.
Ilhami Kovanlikaya, M.D.
Yi Li, M.D., Ph.D.
Rajiv Magge, M.D.
Anna Nordvig, M.D.
Susan Pannullo, M.D.
David Pisapia, M.D.
Rohan Ramakrishna, M.D.
Lisa Ravdin, Ph.D.
Theodore Schwartz, M.D.
Dikoma Shungu, Ph.D.
Yi Wang, Ph.D.
Award or Grant: National Institutes of Health (NIH)/National Institute of Biomedical Imaging and Bioengineering (NIBIB) Clinician-Scientist T32 Training Grant in Biomedical Imaging (2009-2010)
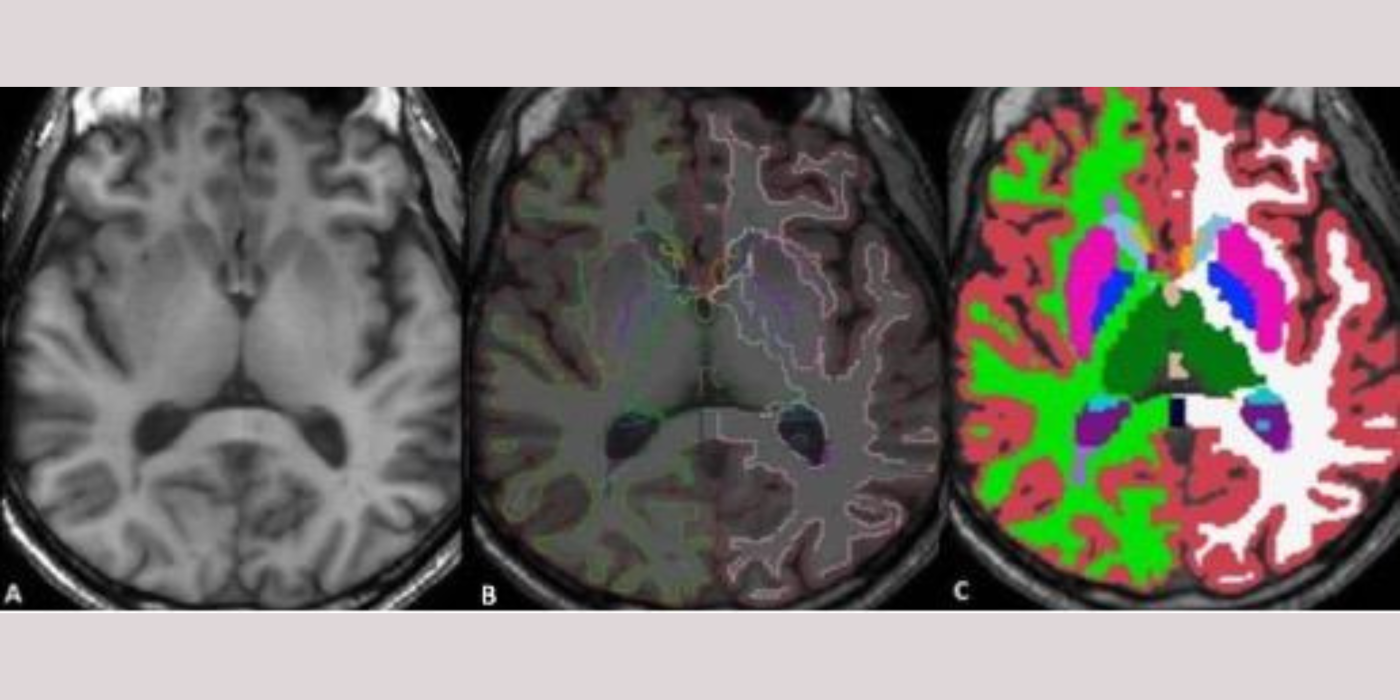
This study used multimodal imaging techniques (voxel-based morphology...
Award or Grant: R01, National Institutes of Health (NIH)/National Institute of Neurological Disorders and Stroke (NINDS) (2016-2021)
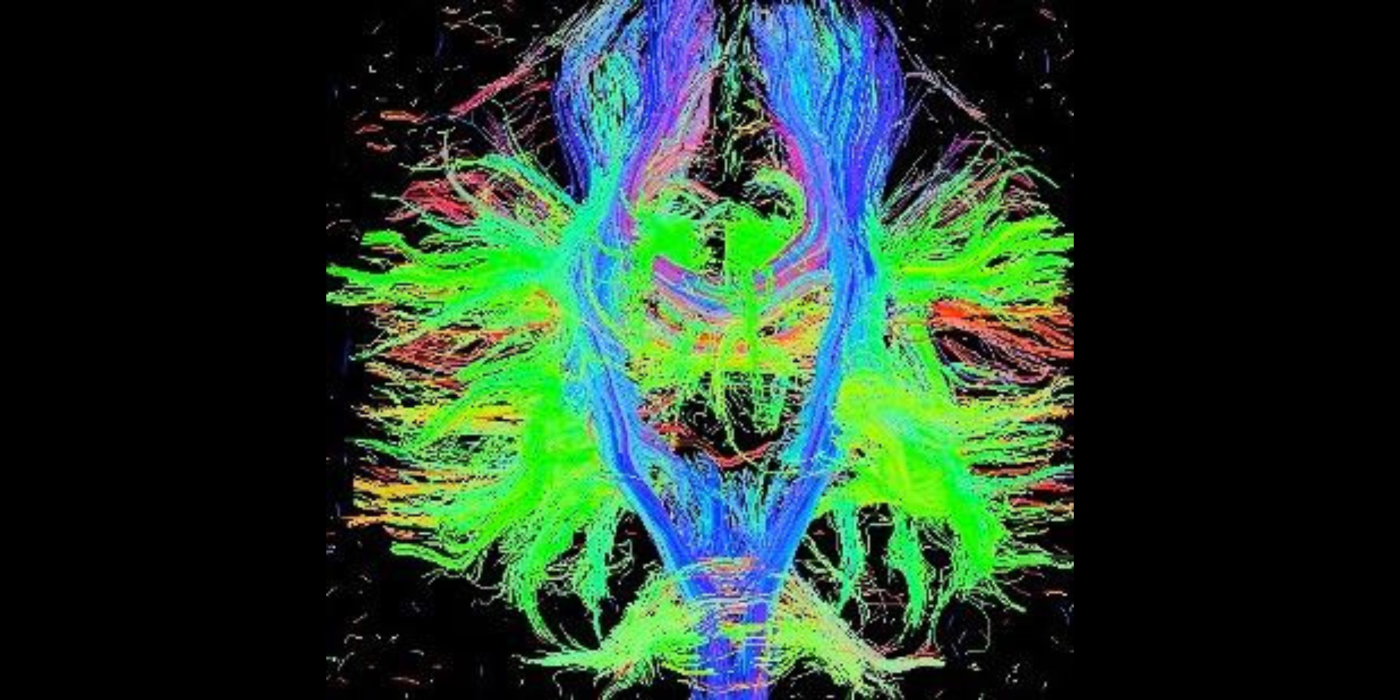
This study will aim to use brain connectivity to quantitatively model the spread of Parkinson’s disease...
Award or Grant: R44, National Institutes of Health (NIH)/National Institute of Biomedical Imaging and Bioengineering (NIBIB) (2017-2022)
This study will optimize and validate a k-space weighted image average algorithm for reducing dose of computed tomography (CT)...
Award or Grant: R01, National Institutes of Health (NIH)/National Institute on Aging (NIA) (2020-2025)
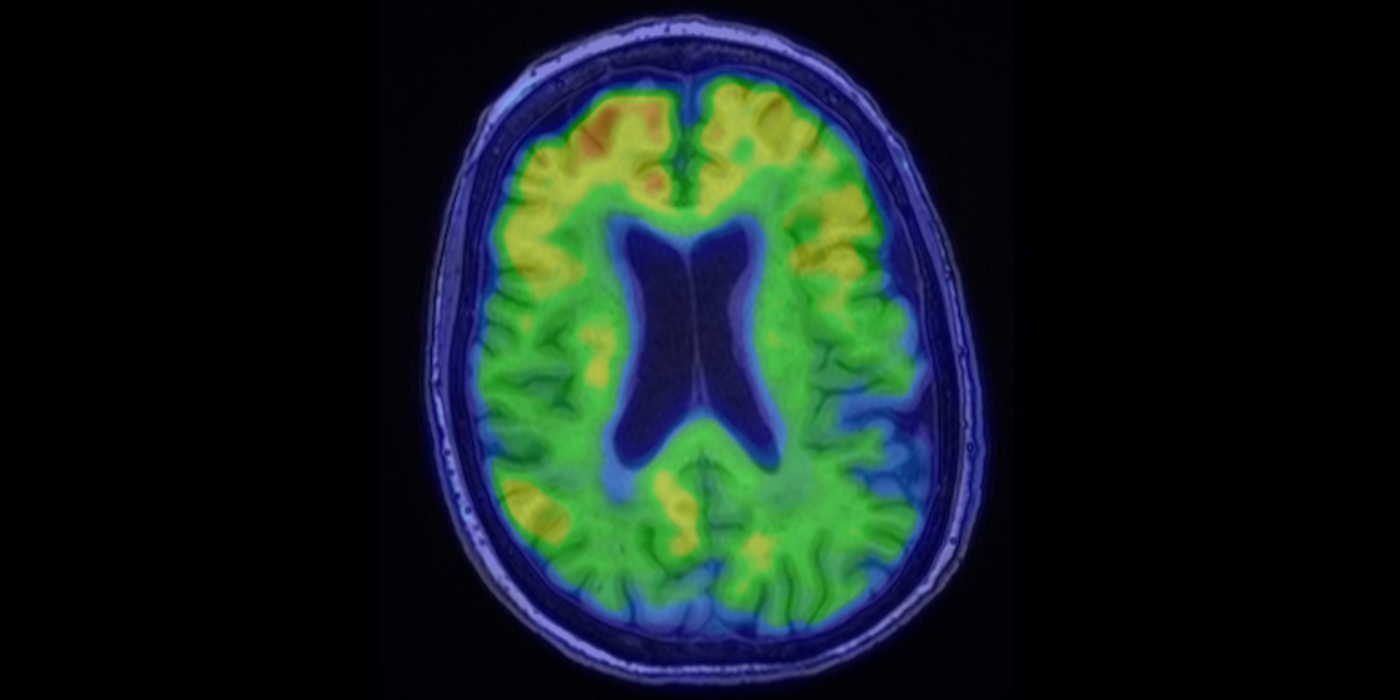
Preclinical and postmortem studies have shown that iron colocalizes with beta-amyloid plaques, and iron dyshomeostasis can lead to...
Award or Grant: National Institutes of Health (NIH)/National Center for Advancing Translational Sciences (NCATS) (2013-2015)
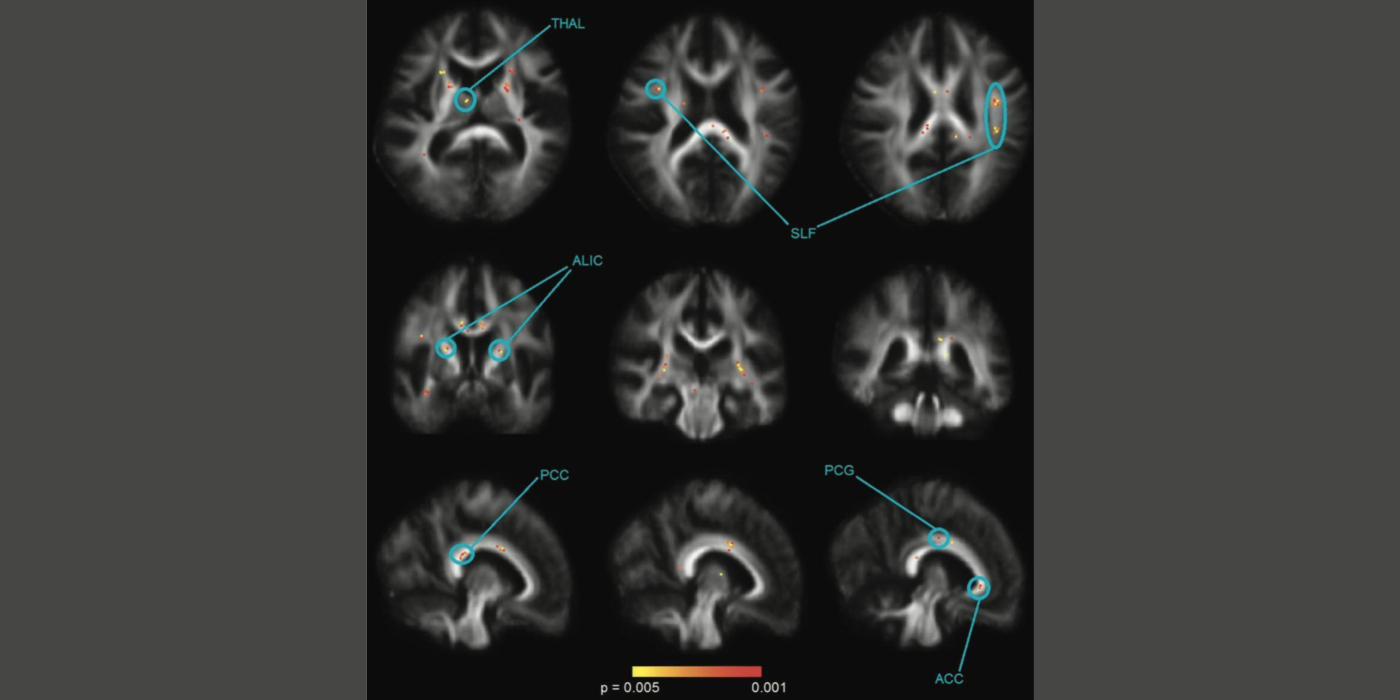
This study investigated the relationships between (1) insulin resistance and brain amyloidosis and, (2)...
Award or Grant: Department of Defense (2013-2018)
The Alzheimer’s Disease Neuroimaging Initiative of the Department of Defense (ADNI-DoD) was a multicenter, observational study to...
This is a High-End Instrumentation Grant to provide support for a state-of-the-art human whole-body seven Tesla (7T) magnetic resonance imaging (MRI) system as a Special Use Instrument at WCM.
This study will establish the diagnostic accuracy of quantitative susceptibility mapping (QSM) in monitoring disease in multiple sclerosis patients, without the use of intravenous gadolinium, and in predicting acuity of white matter...
This study will establish cellular sources of quantitative susceptibility mapping (QSM) signal in Alzheimer’s disease (AD) brain tissue, and establish QSM as a predictor of...